|
||||||
|
||||||
|
|
|
|
||||
|
Features->Integrated debugging |
||||||
|
C-Free supports GDB and CDB (Debugging Tools
for Windows) debugger, and has been
designed to make the most common debugging tasks easy. C-Free makes using
the debugger easier by providing a toolbar with the most often used
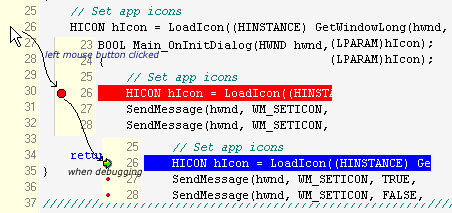
commands. debug toolbar 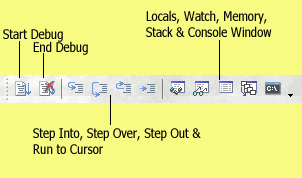 Breakpoints can be inserted or removed easily by left-click your mouse on the gutter of editor. Breakpoints are highlighted in red. And as you debug, C-Free will open the source file in the editor window and highlight in blue the current execution line on breakpoints or steps. It is very easy to trace program execution by setting breakpoints, and clicking on the Step Into or Step Over toolbar button.
breakpoints C-Free also provides you the Locals window, Watch window and Memory window to inspect the value of variable or expression, or memory content within a certain address range. C-Free also provides you the Console window to list the interactive information with GDB and CDB debugger. you also can input commands to control debugger directly.
Related Link: |
||||||
|
|
||||||
|
Copyright © 2004-2010 ProgramArts Software Co., Ltd. All rights reserved. |
||||||